Detectors and DLVAs
Tangential Sensitivity and Video Bandwidth
These two figures are traded against each other. Read either one alone and two parts with the same range will surprise you.
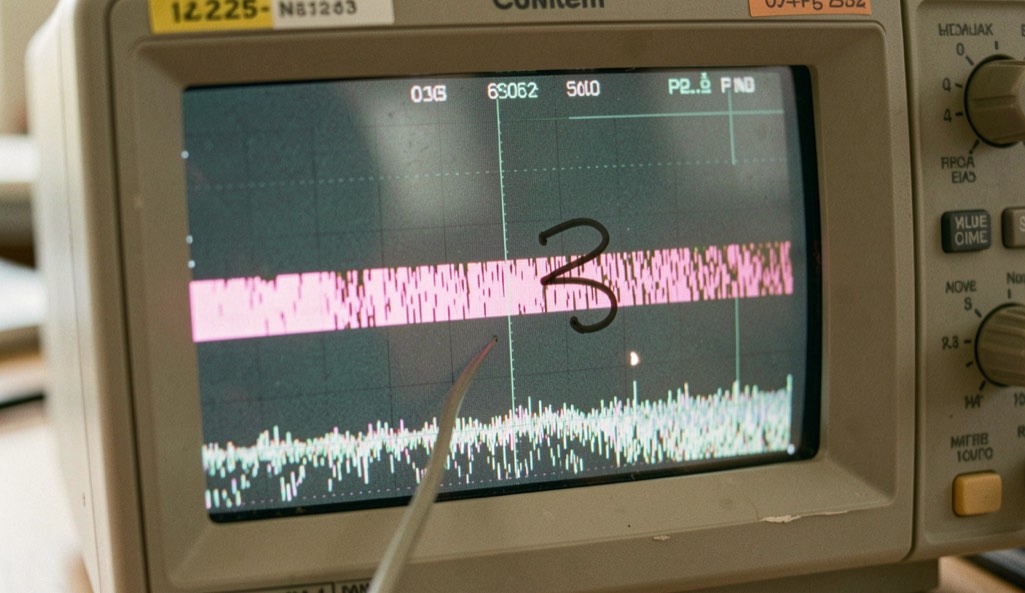
Tangential signal sensitivity, TSS, is the input level at which the top of the noise without a signal and the bottom of the noise with the signal just become tangent on an oscilloscope. The criterion is visual and historical: reproducible in the hands of a careful operator, but dependent on the observer and on the video bandwidth. That bandwidth, the other figure of the pair, fixes the shortest pulse the output reproduces. Widen it and more noise reaches the screen; narrow it and short pulses smear. Neither figure stands alone.
What does tangential sensitivity measure?
What a detector does comes first: it converts radio frequency power into a video voltage. In its low level regime a diode detector responds quadratically, the output voltage being approximately proportional to input power. With no signal the output is noise, a fuzzy band on the screen. A pulsed input lifts the trace during the pulse and forms a second band above the first. Raise the input until the lower edge of the lifted band just touches the upper edge of the idle band; the level where the two become tangent is the TSS. The reading is not instrumental. The operator judges contact between two noisy edges by eye, so two careful people on the same screen can settle on slightly different levels, and the criterion is honest about that.
The same judgment by eye survives in a formalized version on the high-speed serial links that share a chassis with RF chains. The reading desk for PCI Express applies it to the receiver eye diagram: thousands of bit periods folded onto one screen, the opening in the middle read against a stated mask. A tangency and an eye are different traces, but both figures carry their observer and their bandwidth inside them.
Why the video bandwidth sits inside the TSS number
The video bandwidth is the bandwidth of the output side, and the noise band on the screen has already passed through it. Widen that bandwidth and more noise reaches the screen: both bands thicken, the lifted band must climb higher before its lower edge meets the idle band, and the tangency lands at a higher input level. The TSS figure degrades. Narrow it and the bands thin; the meeting happens lower and the figure improves. A TSS value is a property of the diode together with the video bandwidth it was measured through, not of the diode alone. Two parts of one design, characterized at different video bandwidths, can carry different TSS numbers, and both datasheets are correct. What the column does not say is which bandwidth each number assumes.
What does a wider video bandwidth buy?
Pulse fidelity. The video bandwidth fixes the shortest pulse the output reproduces faithfully; a pulse shorter than the band can carry comes out smeared. Edge speed is read by convention, between the 10 percent and 90 percent points of the final amplitude; that convention is common practice rather than a requirement of any standard, and it means something only when the band is wide enough to show the edge at all. The wider video bandwidth buys shorter reproducible pulses and readable edges, and the price is the noise that enters through the same door.
Two columns, one exchange rate
Read as a pair, the two figures describe one output filter seen from two sides. The exchange runs both ways.
| Figure or move | What it gains | What it costs the other |
|---|---|---|
| Video bandwidth narrowed | Thinner noise bands; tangency arrives at a lower input level and the TSS figure improves | The shortest reproducible pulse lengthens; short pulses smear |
| Video bandwidth widened | Shorter reproducible pulses with readable edges | More noise passes; tangency climbs and the TSS figure degrades |
| TSS quoted alone | A single number, easy to rank down a column | Silent on the video bandwidth behind it and on the observer |
| Video bandwidth quoted alone | Defines which pulse durations the part reproduces | Says nothing about the noise, so nothing about the sensitivity to expect |
Where does the log amplifier enter?
A log video amplifier compresses a wide input range into an output approximately proportional to the logarithm of input power, and a DLVA is a detector and that amplifier specified together, end to end. The specification is a transfer curve, not a number: output voltage follows a straight line against input power in dBm, with a slope quoted in millivolts per dB and an intercept fixing where the ideal line sits. Quality lives in the logging error, the deviation in dB between the real curve and that ideal line; the dynamic range is the input interval over which the error stays inside the stated tolerance, and without the tolerance the range states nothing. Dynamic range is a statement about the straightness of a curve; TSS is a statement about whether a pulse is visible against noise. The rest of that grammar is in reading a transfer curve.
Recovery time, the third figure
Recovery time is the delay after a strong pulse before the detector can measure a weak pulse correctly. Inside that window the weak pulse is simply not measured correctly, whatever the trace seems to show. The duration depends on the part. In any sequence where a strong pulse precedes a weak one, recovery time decides whether the second reading is a measurement at all, and no sensitivity figure rescues it.
Before trusting a sensitivity column
- Find the video bandwidth printed beside the TSS figure; without it the number is unqualified.
- Check that this bandwidth covers the pulse durations you need.
- Read slope and intercept as a pair; neither alone describes the line.
- Look for the tolerance attached to any dynamic range figure.
- When a strong pulse precedes the weak one, find the recovery time first.
- Expect two observers to set the tangency slightly apart; the criterion is visual.
Common mistakes
- Comparing TSS numbers measured through different video bandwidths.
- Treating TSS as a hard detection floor; it is a tangency judged by eye.
- Widening the video bandwidth to catch short pulses and expecting the sensitivity figure to hold.
- Quoting a dynamic range without the logging error tolerance that defines it.
- Reading the slope without the intercept.
- Measuring a weak pulse that arrives inside the recovery time of a strong one.
This trade is learned on a bench. Hold the input level constant, put the video output on an oscilloscope, and switch the video bandwidth between two settings: the noise band thickens or thins, and the tangency level moves. A sensitivity number is a couple, a level and a bandwidth. Write both down, side by side, every time. The parameter index collects these definitions.